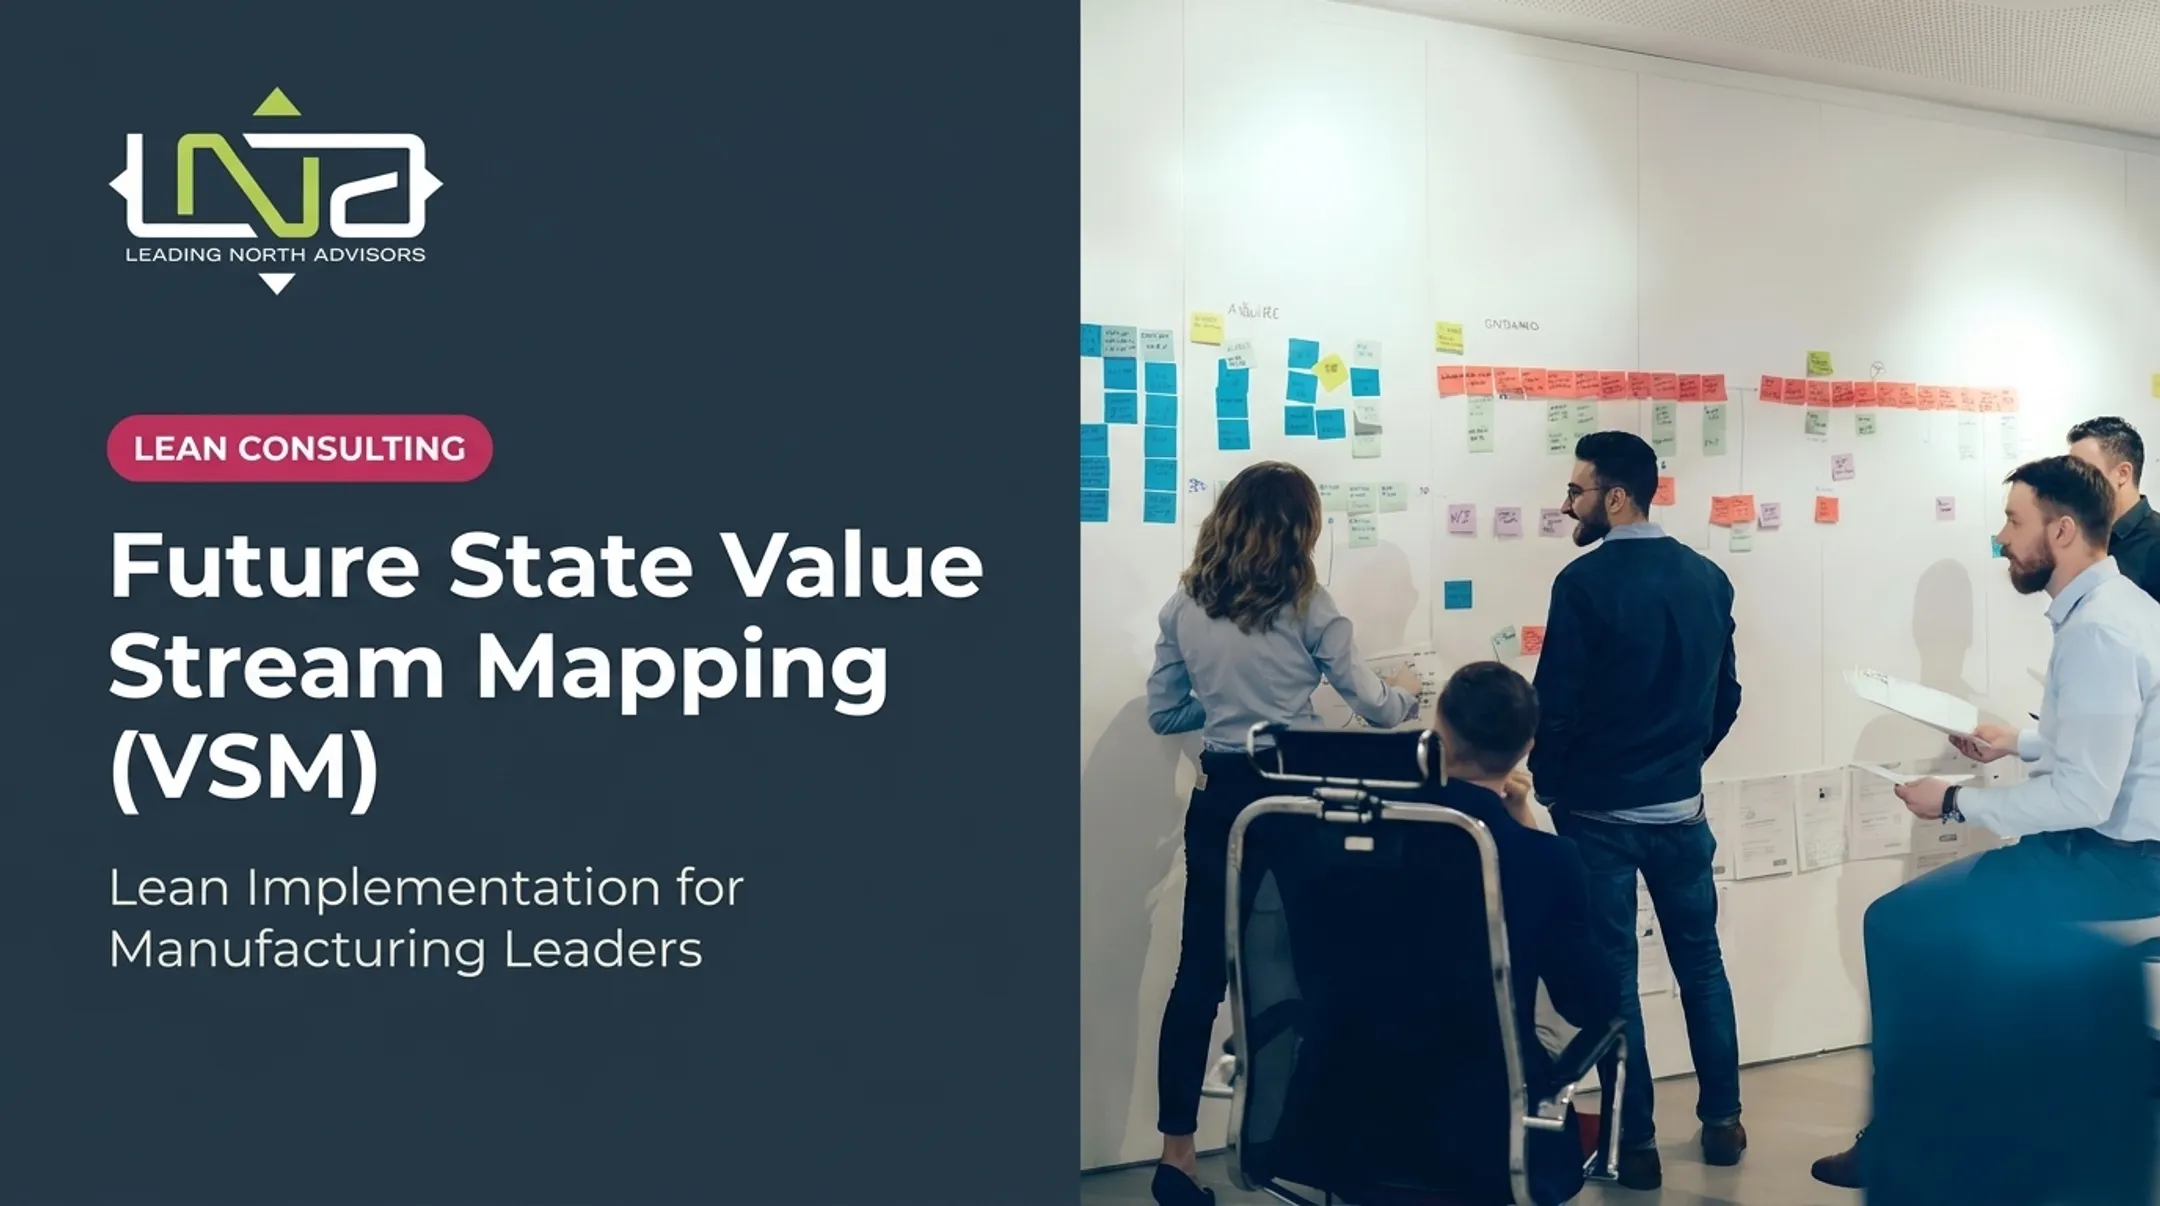

VSM gets mentioned constantly in Lean initiatives, but it's often reduced to a flowchart exercise or a one-and-done drawing session. That's a mistake. Done right, VSM connects shop-floor reality to business results.
This article covers what VSM actually does, why manufacturers use it, how to build current- and future-state maps, what data shapes the analysis, and when a different Lean tool might serve you better.
Key Takeaways
- VSM maps materials, information, and demand across a product family—not one machine or department.
- Effective VSM runs four stages: current-state mapping, waste analysis, future-state design, and implementation.
- Accurate maps come from shop-floor observation, not outdated docs or assumptions.
- Tie waste reduction to measurable priorities: lead time, inventory, quality, and delivery.
- Cross-functional ownership turns a map into results; a map nobody implements changes nothing.
What Is Value Stream Mapping?
Value stream mapping (VSM) is a visual representation of every major process, inventory point, material movement, information exchange, and delay involved in moving a product family from supplier inputs through customer delivery. Teams use it to separate customer value-added work from waste and necessary-but-non-value-added activity, then redesign the flow around what actually matters.
Current-state vs. future-state maps:
- A current-state map documents how work operates today, including cycle time, changeover time, uptime, staffing, and inventory levels at each step.
- A future-state map describes the desired flow after Lean improvements: shorter queues, better balance, and tighter alignment to customer demand.
VSM isn't the same thing as a detailed process map. Process mapping zooms into individual tasks and decisions within one process. VSM works at the end-to-end, cross-functional level, emphasizing flow, lead time, inventory, handoffs, and information rather than task-by-task detail.

The Building Blocks of a Value Stream Map
A standard VSM includes several recurring elements:
- Customer demand and supplier data boxes
- Process boxes showing each major operation
- Data boxes capturing cycle time, changeover, and uptime
- Inventory triangles marking queue and stock points
- Push and pull signals between processes
- Material-flow and information-flow arrows
- A timeline comparing processing time to total lead time
This iconography traces back to Toyota's material-and-information-flow diagrams, popularized for a broader audience by Mike Rother and John Shook in Learning to See, first published in 1998. The Lean Enterprise Institute still treats it as the reference text for VSM terminology and symbols.
Why Value Stream Mapping Is Used in Lean Manufacturing
Departments tend to optimize what they can see: their own machine, their own shift, their own scorecard. That local optimization often hides waste that only shows up when you trace the full flow from raw material to shipment. VSM forces that broader view.
Manufacturers turn to VSM because it connects directly to priorities operations leaders already care about:
- Shorter lead times from order to delivery
- Lower work-in-process inventory tying up cash and floor space
- Fewer defects and rework loops
- Improved schedule reliability
- Better equipment utilization
- Less firefighting and faster response to demand changes
How VSM Exposes the Seven Wastes
VSM makes the seven classic Lean wastes visible in context, not just as an abstract list:
- Overproduction – making more than the next process needs, or making it too early
- Waiting – operators idle while machines cycle or parts don't arrive
- Transport – unnecessary movement of materials between steps
- Overprocessing – doing more work than the customer requires
- Inventory – stock beyond what a controlled pull system needs
- Motion – unnecessary operator movement or reaching
- Defects – scrap, rework, and inspection loops
These categories overlap in practice. Excess inventory often exists because of overproduction upstream; a defect problem can generate both waiting and unplanned transport as parts get rerouted for rework.
Connecting Demand, Takt, and Pull
VSM ties customer demand directly to production pace through takt time (available time divided by customer demand). Comparing takt to actual cycle time reveals bottlenecks, imbalance, and overburden: the data that makes pull production and leveling possible instead of theoretical.

Pull and leveling still have to run inside real constraints.
VSM is an operational improvement method, not a regulatory requirement. Regulated manufacturers still need their existing quality, traceability, and documentation controls in place regardless of what a future-state map recommends. Mapping the flow can expose where those controls create delays, but it shouldn't be used to erase them.
Seeing those constraints on one map only works when every function is in the room. A VSM workshop is one of the few exercises that gets production, planning, purchasing, quality, maintenance, and logistics looking at the same picture at the same time. That shared view, on its own, resolves a surprising number of "who owns this" arguments.
How Value Stream Mapping Works: The Four-Step Flow
A practical VSM effort moves through four connected stages. None of it works from a desk alone—teams follow the work at the Gemba and validate what operators say instead of trusting reports, assumptions, or outdated SOPs.
- Define the value stream and the problem
- Observe and document the current state
- Identify waste and constraints
- Design and implement the future state

Step 1: Define the Scope and Map the Current State
Start by selecting a product family — products that share similar processing steps, equipment, and material flow. Mixing unrelated product lines produces a map too muddled to act on.
Before collecting any data, define:
- The customer, supplier, and process boundaries (start and end points)
- The business problem you're solving and the target outcome
- Who owns the project
Assemble a cross-functional team. Leadership, supervisors, operators, production control, quality, maintenance, and materials all bring different pieces of the puzzle. At each process step, capture:
- Cycle time and changeover time
- Uptime, downtime, and staffing
- Yield, defects, and batch size
- Queue, inventory, and wait time
- Transportation distance and information triggers
Once you have this data, compare total lead time against actual value-added processing time. Don't assume a universal "good" ratio exists — measure your own product family's flow and treat that as your baseline.
Step 2: Analyze Waste, Bottlenecks, and Flow Interruptions
Mark waiting, excess inventory, rework, unnecessary movement, and unreliable information as opportunities to investigate — not automatic waste to eliminate. Some of what looks like delay is actually necessary buffer for quality or safety reasons.
Compare customer demand and takt time against actual cycle times and available capacity. This reveals where bottlenecks, imbalance, or overburden are actually occurring, rather than where people assume they are.
Trace problems upstream. A downstream queue might trace back to a late quality check. Excess safety stock might trace back to unreliable upstream equipment. Supporting tools help here:
- Spaghetti diagrams for tracking unnecessary movement
- Yamazumi charts for visualizing workload balance
- Root-cause analysis for recurring defects
- Process maps for task-level detail within one step
Prioritize what you find by customer impact, operational risk, feasibility, and required investment.
Step 3: Design the Future-State Map
A future state should be a practical, achievable flow, not an idealized diagram that ignores equipment, labor, safety, or capital limits. Common design principles include:
- Continuous flow where feasible
- Pull replenishment and controlled supermarkets
- Production leveling and balanced work
- Point-of-use materials and standard work
- Shorter changeovers and built-in quality checks
Reduce unnecessary handoffs and connect information flow to the actual pace of production through clear scheduling and escalation signals. Separate immediate countermeasures (things you can pilot this month) from longer-term capital or technology projects that need a business case.
Then translate the map into specific kaizen events with named owners, milestones, required resources, and performance measures. Without named owners, a future-state map rarely turns into action.
Step 4: Implement, Measure, and Sustain the Future State
The map isn't the improvement — implementation is. This is where redesigned methods, layouts, schedules, and standards actually get tested with real production.
Best practice is to pilot changes in a bounded area first, validate the effect at the Gemba, then update standard work and involve affected operators in refining it. Track metrics like lead time, inventory, on-time delivery, first-pass yield, changeover time, and downtime after implementation, not just at the kickoff meeting.
When this discipline holds, results compound. At Medtronic's Xomed plant, mapping 48 value streams and applying pull and bottleneck analysis cut production lead time from 253 days to 129 days over three years and reached 96% on-time delivery.
Carlyle Johnson Machine Company paired a current-state VSM with flow redesign and visual management, cutting RMA lead time from 43 days to 5 days and raising first-pass yield from 10% to 90%.
Daily management, visual controls, and scheduled map reviews prevent regression. Treat the future state as the new current state and revisit it — don't file the map away once the kaizen events end.
Where Value Stream Mapping Is Applied
VSM shows up across nearly every manufacturing function: raw-material receiving, machining, assembly, fabrication, packaging, warehouse replenishment, order fulfillment, quality release, and maintenance-support flows.
Scope can range from a single production line to an entire plant, product family, or multi-site supply network. What matters is keeping the scope manageable and tied to a defined customer outcome.
Common triggers that prompt a VSM effort:
- Persistent late deliveries or missed commitments
- High work-in-process or excess finished goods
- Frequent schedule changes or expediting
- Recurring quality problems
- Long changeovers or unplanned downtime
- New facility design or product introduction
- A broader Lean transformation kickoff
VSM works best as a structured, recurring cycle rather than a one-time event. Revisit maps after major process, demand, product, layout, or supply-chain changes.
The same underlying principles extend into healthcare, construction, food and beverage, and public-sector operations, though the examples in this piece stay focused on manufacturing.
Key Factors That Affect Value Stream Mapping in Manufacturing
These factors determine whether a VSM effort produces a usable future state:
- Product family scope: Map products with similar routings and demand; mixed families blur the picture and yield changes no one can run.
- Customer demand and takt: Volume, mix, seasonality, and forecast reliability set the pace the future state must hit.
- Process and equipment data: Pull cycle time, changeover, uptime, yield, and maintenance condition from measured or system data—not memory.
- Inventory and material flow: Raw materials, WIP, batch sizes, storage points, and supplier lead times show how work really moves.
- Information and planning flow: Orders, forecasts, kanban signals, and quality releases often constrain flow as much as the shop floor.
- Cross-functional team: Include operators, supervisors, and one senior leader; groups of about 8–12 keep the map accurate and actionable.
- Safety, quality, and compliance: Inspection points, traceability, and ergonomic rules define which improvements are viable.
- Scale and capacity: Multi-site manufacturers should sequence projects to match capital and leadership bandwidth—not launch everything at once.
Common Issues, Misconceptions, and When VSM Isn't the Right Fit
Where VSM Efforts Go Wrong
The biggest misconception is treating VSM as a drawing exercise. The map only creates value when it drives observation, waste analysis, future-state design, implementation, and follow-up—not when it stops at a finished diagram.
Other recurring issues:
- Assuming every non-value-added step can disappear at once, when some exist for quality, safety, or compliance
- Mapping only one department or machine, which misses upstream scheduling problems and downstream queues
- Relying on averages or outdated documentation instead of checking actual variation and operator workarounds at the Gemba
- Improving one metric while shifting waste elsewhere (for example, speeding up one station and creating a larger queue at the next)
- Excluding frontline employees or assigning no clear improvement owner, which stalls implementation
When a Different Tool Might Serve You Better
VSM isn't always the right starting point. It tends to struggle with:
- Highly unique or one-time work with no repeatable flow
- Unstable processes that haven't settled into a consistent pattern
- Very narrow problems confined to a single process step
In those cases, a process map, spaghetti diagram, standard-work analysis, or root-cause analysis often gets you further, faster. Don't attempt VSM without a defined customer, product family, problem statement, and a decision owner who can authorize change. Mapping without that authority produces a wall chart and little else.

VSM also should not bypass safety, quality, or customer requirements just to cut cycle time or inventory.
If your team lacks mapping experience or the cross-functional authority to act on the map, bring in experienced facilitation before you start. Leading North Advisors helps manufacturers close that gap so the value stream map becomes an executed improvement plan, not a poster.
Conclusion
Value stream mapping gives manufacturers a way to see the complete flow of materials, information, time, inventory, and customer demand across a product family, instead of optimizing one machine in isolation.
The strongest results come from accurate current-state observation, a future-state design grounded in real constraints, cross-functional ownership, and disciplined implementation. A map by itself changes nothing.
To keep the work from stalling:
- Choose a suitable value stream
- Use reliable data instead of assumptions
- Protect safety and quality requirements
- Tie every proposed change to a measurable operational or customer outcome
That discipline is what turns VSM into shorter lead times, lower inventory, and clearer flow—not a poster that gathers dust. Leading North Advisors helps manufacturers and operations teams carry current- and future-state maps through cross-functional implementation so the gains show up in the numbers.
Frequently Asked Questions
What is value stream mapping?
Value stream mapping is a Lean method that visualizes the end-to-end material and information flow needed to deliver a product to a customer. It separates value-added work from waste to guide current-state and future-state planning.
What are the four steps of value stream mapping?
The four steps are: mapping the current state, analyzing waste and constraints, designing the future state, and implementing the plan. Some methodologies break this into six steps by separating team preparation and scope definition upfront.
What are the 7 wastes in value stream mapping?
The seven wastes are overproduction, waiting, transport, overprocessing, inventory, motion, and defects. For example, overproduction might create excess inventory downstream, while unreliable equipment often drives extra safety stock.
What are some examples of value stream mapping in manufacturing?
Common applications include assembly lines, machining cells, packaging, order fulfillment, warehouse replenishment, and full raw-material-to-shipment flows. Any repeatable product family with measurable process steps is a candidate.
Is value stream mapping part of Lean Six Sigma?
Yes, VSM is a core Lean tool frequently used alongside Six Sigma methods like DMAIC when a team needs flow improvement and defect or variation reduction working together.
What is the best software for value stream mapping?
The right choice depends on process complexity, team collaboration needs, data integration, and budget. Many teams start with a wall and sticky notes to validate the map before digitizing it in dedicated software.