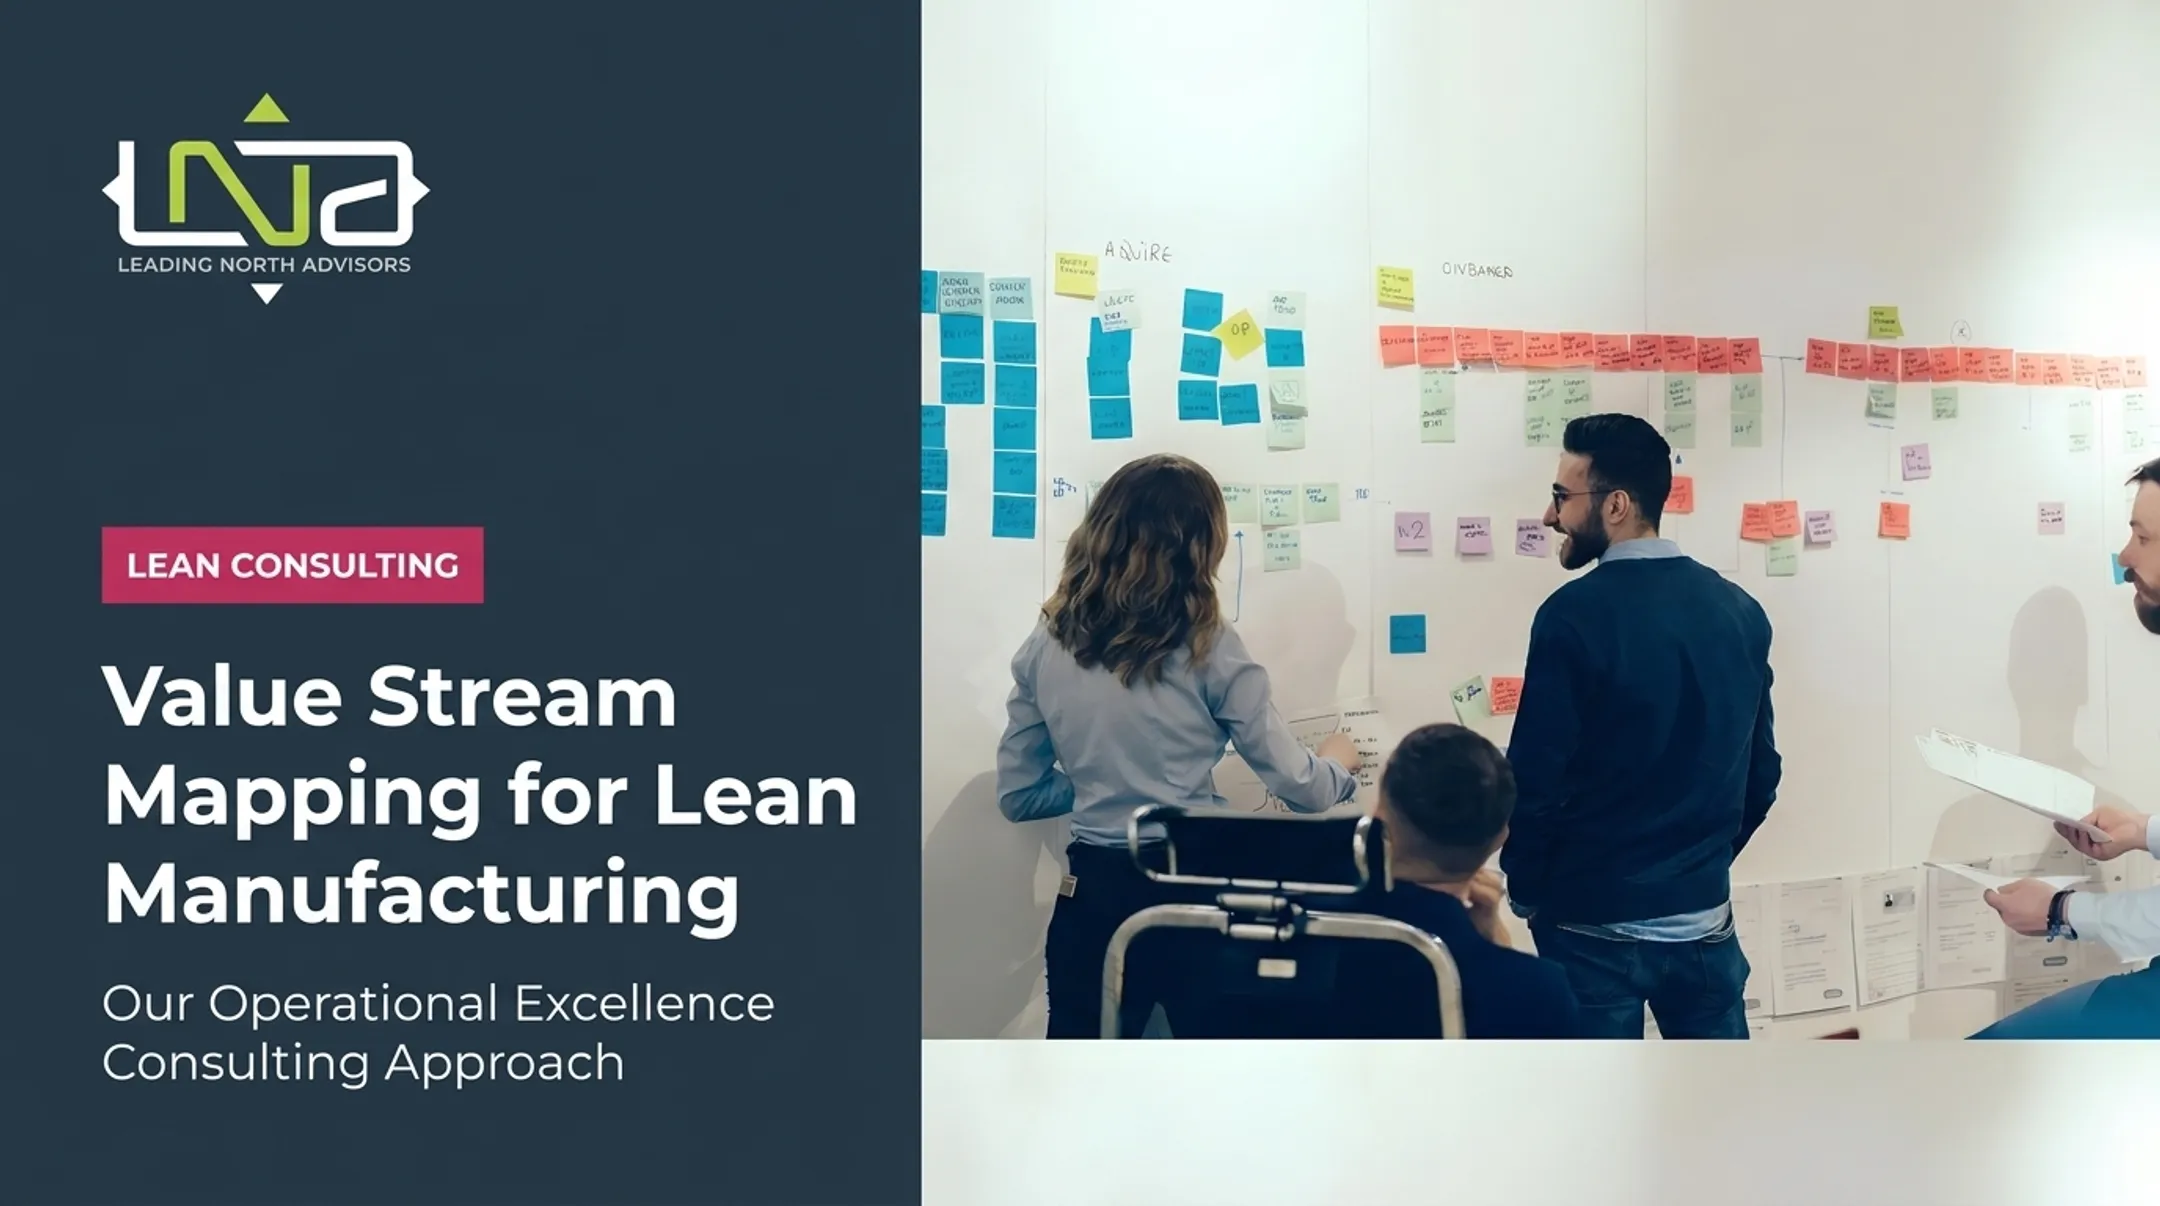

This guide is written for operations leaders, Lean practitioners, and improvement teams working in manufacturing, healthcare, construction, food and beverage, automotive, and public-sector environments across the United States.
Here's the problem most teams run into: they draw a beautiful current-state map, spot the waste, and then stall. Nobody agrees on what "better" actually looks like. Nobody owns the next step. The map becomes wallpaper.
This article covers what a future-state map is for, how to build and read one, the Lean principles that hold it together, the mistakes that sink most attempts, and what should happen the day after the map is finished.
Key Takeaways
- A future-state map is a target condition grounded in customer demand and process capability, not a wish list.
- The current-state map is your baseline; the future-state map shows what must change to cut waste and improve flow.
- A good map ends in an implementation plan with owners, priorities, measures, and review dates.
- Future-state VSM works for service and admin processes when you map the full stream from customer need to delivery.
What Is Future State Value Stream Mapping?
Future-state VSM shows how work, materials, information, and decisions should move once your team closes the gaps found in the current state. It visualizes the value stream you're designing toward, not the one you're stuck with.
The goal is a value stream with less waiting, less excess inventory or work-in-process, less rework, fewer unnecessary handoffs, and steadier flow overall.
Current State vs. Future State vs. Ideal State
These three terms get mixed up constantly. They're not interchangeable.
| Map Type | What It Shows |
|---|---|
| Current state | How work actually operates today, based on observed data |
| Future state | A feasible target condition and the specific changes needed to reach it |
| Ideal state | A theoretical picture with all waste removed, useful for direction but not a real implementation target |
The future state has to account for actual constraints: your equipment, your staffing, your budget, your timeline. The ideal state doesn't carry that baggage, which is exactly why it can't be your action plan.
Customer Demand Drives the Design
You can't design a future state in a vacuum. It has to answer to customer demand patterns, service expectations, quality requirements, and delivery commitments. Skip this step and you'll design a process that flows beautifully but misses what the customer actually needs.
Key Elements You'll See on the Map
A typical future-state map includes:
- Customer and supplier information
- Process boxes with cycle time, uptime, and changeover data
- Material and information flow lines
- Inventory or queue points, including supermarkets
- A pacemaker process that sets the pace upstream
- Kanban or pull signals
- A lead-time ladder comparing waiting time to processing time
Treat the map as a decision-making tool. Its value is the alignment it forces: agreement on how work should flow and which problems get solved first.
How to Create and Read a Future State VSM
Set the Foundation Before You Draw Anything
Start with a verified current-state map and a clearly bounded scope, such as a product family, service line, patient journey, project type, or administrative workflow. Mapping "the whole operation" produces a map nobody can use.
Before you sketch a single box, nail down:
- Customer outcome, demand pattern, delivery frequency, and quality expectations
- Baseline data: cycle time, lead time, changeover time, uptime, queue size, staffing, defect and rework rates, and key handoffs
- The largest gaps between what the customer needs and what the process currently delivers
Pull this data from actual observation and your own systems. Don't estimate it to fill a template.
Test Flow Against Takt Time
Takt time tells you the pace customer demand requires. Cycle time tells you how long a given process step actually takes. If cycle time at your bottleneck step exceeds takt time, no amount of clever flow design will fix the gap until you address capacity.
Design Material Flow and Information Flow
For material and work flow, decide:
- Where one-piece flow or smaller batches are realistic
- Where a pull system, supermarket, or queue limit beats push scheduling
- Which bottlenecks, imbalances, and handoffs need redesign
For information flow, define:
- Who receives demand signals
- Who schedules the pacemaker process
- How upstream work gets triggered
- How exceptions get communicated
A future state with no information flow design is just a nicer-looking current state.
A Quick Illustrative Example
Say a fictional packaging line runs 12-hour changeovers between product runs, creating three days of finished-goods backlog. A future-state redesign might set a pacemaker at final packaging, add a small supermarket between mixing and filling, and cut changeover time through external setup work.

That single change, tested and measured, could cut backlog without touching headcount. (This is an illustrative scenario, not a Leading North Advisors client case.)
How to Read a Finished Map
Follow the map the same way work actually moves:
- Customer demand signal
- Information flow
- Process boxes
- Inventory or wait points
- The pacemaker
- Lead-time ladder at the bottom
If you can't trace that path start to finish without confusion, the map isn't done yet.
Design Principles and Applications
Core Design Questions
Every future-state design should answer:
- Where does value begin and end from the customer's perspective?
- Which steps should flow continuously, and where does a controlled buffer make sense?
- What process should set the pace for everything else?
- How does quality get built in, instead of inspected in after the fact?
- What can be simplified, eliminated, consolidated, automated, or reassigned without adding risk?
How It Plays Out by Industry
| Industry | Common Focus Areas |
|---|---|
| Manufacturing | Production cells, takt alignment, changeovers, quality at the source |
| Healthcare & public services | Patient/constituent journeys, scheduling, approvals, backlogs |
| Construction | Design information, procurement, field coordination, schedule reliability |
| Food & beverage | Uptime, changeovers, food-safety controls, demand variability |
AHRQ notes that clinical variation can make consistent VSM application difficult, since patient conditions and needs differ case by case. Map the shared flow first, then pair it with tools that explain the variation.
What Constrains the Future State
Real-world limits shape every design. Ignore them and your map turns into fiction:
- Safety and regulatory requirements
- Quality controls and equipment capability
- Workforce skills and supplier reliability
- Capital availability and organizational readiness
Two Horizons Beat One
Build a near-term target achievable through process and management changes, plus a longer-term target that depends on technology, facility, staffing, or capital investment. This keeps teams moving now instead of waiting for a big-budget approval that may take a year.
Measuring Whether It's Working
Pick measures relevant to your value stream:
- Lead time and queue/inventory levels
- Throughput and first-pass yield
- Defect or rework rates
- On-time delivery, patient or customer wait time
- Safety performance and employee workload
Whatever you select, substantiate it with your own data. A NIST-documented case at Raymond Hadley Corp shows what disciplined follow-up delivers: main-line changeover time down 50% for a key customer, order-processing time cut 80%, and re-clean/re-test rates dropped from 50% to zero.

Those measures only hold if the map matches reality. Review it at the gemba with the people who do the work—a polished diagram can still miss workarounds, interruptions, and informal information flows on the floor.
This is where many internal teams get stuck: they have the map but not the coaching capacity to drive implementation.
Leading North Advisors supports Lean transformation, training, and practitioner-led implementation for organizations that need future-state plans tied to culture change and measurable results—not just a cleaner diagram.
Common Issues and When It May Not Be Appropriate
Treat a future-state map as a target condition, not a prediction, technology blueprint, or green light to cut resources. It still needs testing, learning, and controlled rollout.

Common design failures:
- Designing from conference-room assumptions instead of direct observation and frontline input
- Treating every non-value-adding step as removable without weighing compliance, safety, or risk
- Optimizing one department while increasing total lead time elsewhere
- Drawing a future state with no pacemaker, pull signal, owner, or measurement plan
- Confusing a faster single step with genuinely improved end-to-end flow
Delay or supplement future-state VSM when:
- Scope is unclear or too broad to map meaningfully
- Demand is highly unstable
- Baseline data is unreliable or missing
- The process needs detailed root-cause analysis before anyone redesigns it
In those cases, use complementary tools first:
- SIPOC for scope clarity
- Customer journey mapping for experience gaps
- Root-cause analysis for underlying problems
- Standard work analysis for baseline discipline
- Simulation for testing variable flows
- A project charter to define the effort before you map
Conclusion
Future State Value Stream Mapping turns an observed problem into a shared, visual target for better customer value, flow, quality, and performance. The strongest maps connect customer demand, takt or service requirements, process capability, information flow, pull, quality, people, and clear implementation ownership.
The map itself is only the start. Teams still have to:
- Prioritize gaps between current and future state
- Test countermeasures before full rollout
- Track the right performance measures
- Revise the design as conditions shift
If you need help facilitating a future-state workshop, training internal Lean practitioners, or turning a map into a plan that sticks, Leading North Advisors can help.
Frequently Asked Questions
What can you learn from a future state value stream map?
You can see the intended process flow, how it responds to customer demand, and where information signals, inventory, and queues sit. It also flags bottlenecks plus priority improvements with resource needs and measures.
What is the difference between a current state and a future state value stream map?
The current state documents observed, real conditions on the floor today. The future state describes a desired and feasible design used to guide the improvement work ahead.
What is considered the ideal state in a value stream map?
The ideal state imagines the process with every form of waste removed, a theoretical benchmark. The future state accounts for real constraints and sets a practical improvement horizon instead.
What is value stream mapping in simple terms?
VSM is a visual picture of how work and information move from customer need through delivery. It helps teams see waste clearly and plan a better way to flow the work.
How do you create a future state value stream map?
Start by setting scope and validating the current state, then analyze customer demand and design the future flow. Identify gaps, review with stakeholders, and turn the findings into an action plan with owners and dates.
What should happen after creating a future state value stream map?
Prioritize the gaps, assign owners, set measures and timelines, run improvement experiments, and review progress through daily management or a regular improvement cadence.